© All rights reserved. Powered by Florisera.

RSS Daily tech news
  • Physicists discover a copper-free high-temperature superconducting oxide
    Engineers have designed and synthesized a groundbreaking new material -- a copper-free superconducting oxide -- capable of superconducting at approximately 40 Kelvin, or about minus 233 degrees Celsius, under ambient pressure.
  • A lighter, smarter magnetoreceptive electronic skin
    Imagine navigating a virtual reality with contact lenses or operating your smartphone under water: This and more could soon be a reality thanks to innovative e-skins. A research team has developed an electronic skin that detects and precisely tracks magnetic fields with a single global sensor. This artificial skin is not only light, transparent and […]
  • E-scooter crashes mainly caused by reckless driving
    Crashes on electric scooters are mostly due to the behavior of the riders, with one-handed steering and riding in a group being some of the largest risk factors. The researchers are also concerned about riders who deliberately crash or cause dangerous situations when riding, a phenomenon that seems to be specific to electric scooters.
  • These electronics-free robots can walk right off the 3D-printer
    This a robot can walk, without electronics, and only with the addition of a cartridge of compressed gas, right off the 3D-printer. It can also be printed in one go, from one material.
  • Good vibrations: Scientists discover a groundbreaking method for exciting phonon-polaritons
    Newly published research demonstrates a novel way of generating phonon-polaritons by making electrons collide with crystal lattice structures. The discovery paves the way for cheaper, smaller long-wave infrared light sources and more efficient device cooling.
  • New platform lets anyone rapidly prototype large, sturdy interactive structures
    A rapid prototyping platform called VIK (Voxel Invention Kit) enables makers without engineering expertise to create large-scale interactive devices using a series of reconfigurable electromechanical building blocks. These user-friendly components can be assembled using only a soldering iron and a pair of pliers.
Figures and tables list

Dissertation Figure and Table List | Tips and Examples

by Florius

The list of figures or tables is part of the series on how to write your dissertation and it should be placed immediately following the table of contents in your dissertation. This list should include all figures or tables used in the document, along with their captions and corresponding page numbers. While these lists are not required, they can make the overall document more organized and easy to navigate. Additionally, be sure to provide descriptive captions for each figure or table, such as “High Field Quasi-Optical Experimental Setup” instead of simply “Experimental Setup.”

1. How to create a list of figures in Word

To create a list of figures, tables or even equations in MS Word, can be difficult if you do not know where to look. Below I explain with figures and text how to make your own list. For additional information, please consult the website of Microsoft Office.

  • Place the cursor on the top of the page where you want the list of figures/tables to be.
  • Go to References > Insert Table of Figures (Even if you want to make a list of tables or equations).
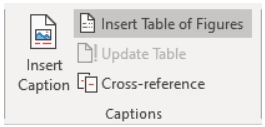
How to create a list of figures.
  • In the dialog box, select the label for which you want to make the list from the “Caption Label Pulldown” (this can be Equation, Figures, Tables).
  • You can change the formatting in the same dialog box to Formal.
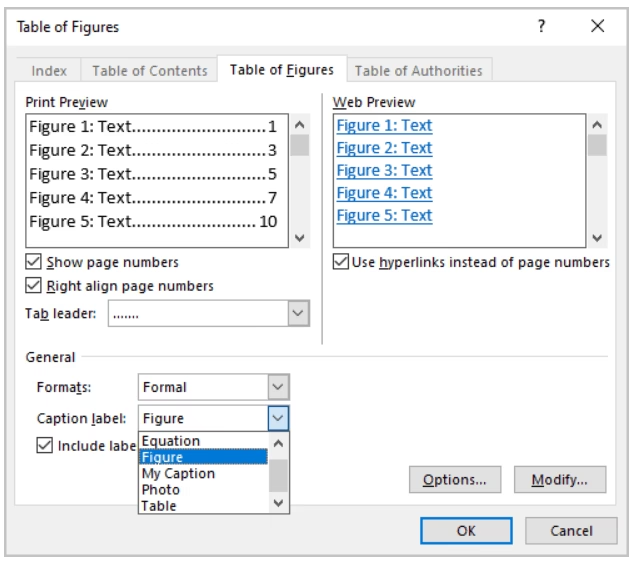
How to create a list of figures.

2. Example

LIST OF FIGURES

Figure 1. Flowchart of the research methodology……………………………………………………………………………………………1

Figure 2. Bar graph illustrating the relationship between X and Y variables……………………………….2

Figure 3. Scatterplot showing the correlation between A and B…………………………………………………………..3

Figure 4. Schematic diagram of the experimental setup…………………………………………………………………………4

Figure 5. Pie chart representing the distribution of survey responses……………………………………………5

Figure 6. Line graph depicting the trend of the data over time…………………………………………………………….6

Leave a comment

This site uses Akismet to reduce spam. Learn how your comment data is processed.

Visual Portfolio, Posts & Image Gallery for WordPress