RSS feed: Daily tech news Daily tech news
  • Physicists defy expectations by controlling the magnetic heart of a single atom
    Scientists have unexpectedly discovered how to control the magnetic spin inside a single atom's nucleus using radio waves, overturning previous assumptions about atomic behavior. The breakthrough could pave the way for more reliable quantum memory, although researchers are still trying to understand why it works.
  • Scientists discover a surprisingly simple way to turn coffee waste into fuel
    Scientists have developed an efficient method to transform used coffee grounds into a potential source of biodiesel while preserving the leftover material for other renewable fuels and valuable chemicals. The discovery could turn millions of tons of discarded coffee waste into a surprisingly useful resource for sustainable energy.
  • Scientists capture electrons making seemingly impossible quantum jumps
    Scientists have captured electrons making seemingly impossible jumps across forbidden energy gaps in graphene, with some transitions occurring at a remarkable 100% probability. The breakthrough offers an unprecedented look at quantum behavior and could help unlock a new generation of ultrafast, light-controlled electronics.
  • Tiny flaws in diamonds could unlock a quantum computing revolution
    Scientists have discovered a faster way to identify diamond-based materials that could power quantum computers and sensors at room temperature. The breakthrough has already revealed promising new quantum building blocks that could help unlock computing capabilities far beyond those of today's supercomputers.
  • Global fossil fuel emissions set to fall in 2026, but total CO2 keeps rising
    Global fossil fuel emissions are projected to fall in 2026 as renewable energy and electric vehicles gain ground, but rising emissions from deforestation threaten to push total CO2 emissions to a new record. Scientists warn that the world's remaining carbon budget for limiting warming to 1.5°C could be exhausted in less than four years, even […]
  • A hidden limit of space and time could unlock electronics 100,000 times faster
    Scientists have discovered a surprising quantum limit that prevents electrons from being tracked with unlimited precision in both space and time. The breakthrough could pave the way for manipulating chemical reactions and developing electronics hundreds of thousands of times faster than today's technology.
Figures and tables list

Dissertation Figure and Table List | Tips and Examples

by Florius

The list of figures or tables is part of the series on how to write your dissertation and it should be placed immediately following the table of contents in your dissertation. This list should include all figures or tables used in the document, along with their captions and corresponding page numbers. While these lists are not required, they can make the overall document more organized and easy to navigate. Additionally, be sure to provide descriptive captions for each figure or table, such as “High Field Quasi-Optical Experimental Setup” instead of simply “Experimental Setup.”

1. How to create a list of figures in Word

To create a list of figures, tables or even equations in MS Word, can be difficult if you do not know where to look. Below I explain with figures and text how to make your own list. For additional information, please consult the website of Microsoft Office.

  • Place the cursor on the top of the page where you want the list of figures/tables to be.
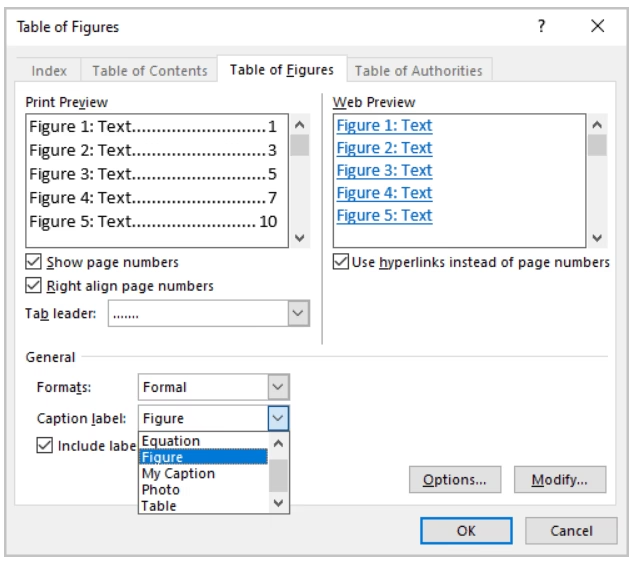
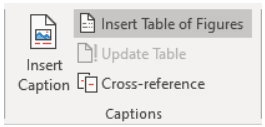
  • Go to References > Insert Table of Figures (Even if you want to make a list of tables or equations).
How to create a list of figures.
  • In the dialog box, select the label for which you want to make the list from the “Caption Label Pulldown” (this can be Equation, Figures, Tables).
  • You can change the formatting in the same dialog box to Formal.
How to create a list of figures.

2. Example

LIST OF FIGURES

Figure 1. Flowchart of the research methodology……………………………………………………………………………………………1

Figure 2. Bar graph illustrating the relationship between X and Y variables……………………………….2

Figure 3. Scatterplot showing the correlation between A and B…………………………………………………………..3

Figure 4. Schematic diagram of the experimental setup…………………………………………………………………………4

Figure 5. Pie chart representing the distribution of survey responses……………………………………………5

Figure 6. Line graph depicting the trend of the data over time…………………………………………………………….6
Leave a comment

This site uses Akismet to reduce spam. Learn how your comment data is processed.

Categories
Instagram