
A t-test is a statistical test used to determine whether there is a significant difference between the means of two groups of data. It is commonly used to compare the means of two groups, such as a treatment group and a control group, or to compare the mean of a sample to a known population mean. The t-test should be explained in the Methodology of your report, and your results should be in the Result chapter. This guide is based on Investopedia > Fundamental analysis tools and StatisticsHowTo.
How do I perform a t-test?
Performing a t-test involves several steps, here is a quick overview of what you need to do to perform a t-test
- Define the null and alternative hypotheses: The null hypothesis states that there is no significant difference between the means of the two groups, while the alternative hypothesis states that there is a significant difference.
- Determine the appropriate t-test: Choose between an independent samples t-test or a dependent samples t-test based on the nature of your data and the research question.
- Check the assumptions of normality and equal variances: It’s important to check that the data is normally distributed and that the variances of the two groups are equal. This can be done using visual methods such as histograms and Q-Q plots or using statistical tests such as the Shapiro-Wilk test or Levene’s test.
- Collect and organize the data: Collect the data for the two groups and organize it in a format that can be easily analyzed, such as in a spreadsheet or statistical software.
- Perform the t-test: Use a statistical software package or a calculator to perform the t-test. Input the data for the two groups and calculate the t-value and the p-value.
- Interpret the results: Compare the calculated t-value to the critical t-value from the t-distribution table. If the calculated t-value is greater than the critical t-value, then it can be concluded that there is a significant difference between the means of the two groups. The p-value is the probability of obtaining a t-value as extreme or more extreme than the one calculated, given that the null hypothesis is true. A low p-value (typically <0.05) suggests that the null hypothesis is unlikely to be true and that there is evidence of a difference between the means.
- Report the results: Report the results of the t-test, including the t-value, the degrees of freedom, the p-value, and the effect size (such as Cohen’s d). Also report the mean, standard deviation and sample size for each group.
It’s important to note that this is a general guide on how to perform a t-test, depending on the specific scenario, some details may vary.
Step 1: Define the null and alternative hypothesis
In step 1 of performing a t-test, you will need to define the null and alternative hypotheses. The null hypothesis is a statement of no difference or no effect, while the alternative hypothesis is a statement of difference or effect.
An alternative hypothesis for a t-test would typically be in the form of: “There is a significant difference in means between group 1 and group 2” or “There is a significant difference in the mean of the sample and the population”.
For example, if you were conducting a study to compare the effectiveness of a new drug to a placebo, the null hypothesis would be “There is no significant difference in mean reduction of symptoms between the new drug and placebo groups” and the alternative hypothesis would be “There is a significant difference in mean reduction of symptoms between the new drug and placebo groups”.
It is important to note that the alternative hypothesis is often written in the positive form and it is the opposite of the null hypothesis.
Step 2: Determine the appropriate t-test
In step 2 of performing a t-test, you will need to determine the appropriate t-test based on the nature of your data and research question. The main consideration is whether the data is independent or dependent.
Independent samples t-test: This test is used when you have two separate groups of data, such as a treatment group and a control group, and you want to compare their means. This test assumes that the two groups are independent and that the data is normally distributed.
Dependent samples t-test (paired samples t-test): This test is used when you have two related groups of data, such as the same group of individuals measured before and after a treatment. This test assumes that the two groups are related and that the data is normally distributed.
When you have more than two groups or samples, you can use an ANOVA (Analysis of Variance) test to compare the means of multiple groups.
Step 3: Check the assumptions of normality and equal variances
Step 3 in performing a t-test is to check the assumptions of normality and equal variances. This is important because the t-test assumes that the data is normally distributed and that the variances of the two groups are equal. If these assumptions are not met, the results of the t-test may be inaccurate.
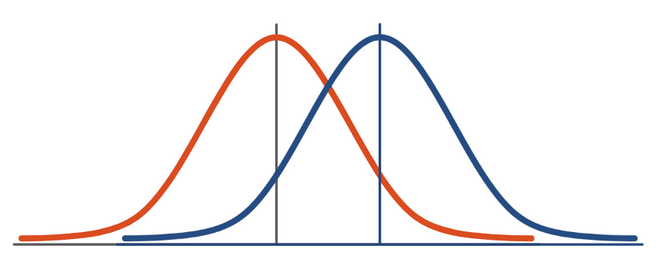
To check the assumption of normality, you can use visual methods such as histograms and Q-Q plots. A histogram is a graphical representation of the data that shows the frequency of each value in the sample. A normal distribution will have a bell-shaped histogram, while a non-normal distribution will have a histogram that deviates from a bell shape. A Q-Q plot (Quantile-Quantile plot) compares the distribution of the sample to a normal distribution. A Q-Q plot that is approximately a straight line indicates that the data is normally distributed.
To check the assumption of equal variances, you can use statistical tests such as the Shapiro-Wilk test or Levene’s test. The Shapiro-Wilk test is a test of normality that also tests the equality of variances. If the p-value of the test is less than the significance level (usually 0.05), it suggests that the variances are not equal. Levene’s test is a test for equality of variances that compares the variances of the two groups. A p-valueless than the significance level (usually 0.05) suggests that the variances are not equal.
If the data is not normally distributed or the variances are not equal, it may be appropriate to use a non-parametric test such as the Wilcoxon rank-sum test (for independent samples) or the Wilcoxon signed-rank test (for dependent samples) instead of the t-test. Alternatively, if the data is close to being normally distributed, the t-test can be used with a correction for non-normality such as the Welch’s t-test.
Step 4: Collecting data and performing t-test
Collecting:
The data collected should be numerical and should be in the form of continuous or ordinal variables. Continuous variables are numeric variables that can take on any value within a certain range, such as weight, height, or temperature. Ordinal variables are categorical variables that can be ordered, such as educational level (elementary, high school, college, graduate).
In a t-test, there are two main types of t-test: independent samples t-test and dependent samples t-test.
For independent samples t-test, two independent samples are collected, one from each group. For example, you might collect data on the weight of a group of individuals taking a new drug and a group of individuals taking a placebo.
For dependent samples t-test, one sample is collected, and the same individuals are measured twice (before and after treatment, for example).
It is important to note that in order to use a t-test, you should have a clear definition of what the groups are, and how the subjects will be assigned to the groups. This is important to minimize the chances of bias and random errors.
It is also important to note that the sample size for t-test should be large enough to obtain a reliable estimate of the population mean and standard deviation, a sample of 30 or more is usually adequate, although the larger the sample size the more powerful the test.
Performing:
There are several statistical software packages that can be used to perform a t-test, some of the most popular ones include:
- SPSS (Statistical Package for the Social Sciences): SPSS is a widely used software package for statistical analysis in the social sciences. It has a user-friendly interface and provides a wide range of statistical tests, including t-tests and ANOVA.
- SAS (Statistical Analysis System): SAS is a powerful and widely used software package for statistical analysis. It offers a wide range of statistical procedures, including t-tests and ANOVA. It is commonly used in business, industry, and government.
- R: R is a free and open-source programming language and software environment for statistical computing and graphics. It has a large community of users and developers who have created a wide range of packages and functions for statistical analysis, including t-tests and ANOVA.
- STATA: STATA is a general-purpose statistical software package that provides a wide range of data analysis tools, including t-tests and ANOVA. It is widely used in economics, biostatistics, and other social sciences.
- Excel: Microsoft Excel can also be used to perform t-tests and ANOVA by using the built-in data analysis tools or by using add-ins such as the Analysis ToolPak or the Real Statistics Resource Pack.
These are just a few examples, there are other software packages available for statistical analysis such as Minitab, and MATLAB, that can also be used to perform t-tests and ANOVA. The choice of software package will depend on the specific requirements of your analysis and the experience of the user.
Step 5: Interpret the results
Compare the calculated t-value to the critical t-value from the t-distribution table. If the calculated t-value is greater than the critical t-value, then it can be concluded that there is a significant difference between the means of the two groups. The p-value is the probability of obtaining a t-value as extreme or more extreme than the one calculated, given that the null hypothesis is true. A low p-value (typically <0.05) suggests that the null hypothesis is unlikely to be true and that there is evidence of a difference between the means.
Example
Let’s say you are comparing the mean weight loss of a group of individuals taking a new diet drug to a group of individuals taking a placebo. The output of the independent samples t-test might look like this:
					t-value: 2.57
p-value: 0.014
Degrees of freedom (df): 18
In this example, the t-value is 2.57, the p-value is 0.014, and the degrees of freedom is 18.
The t-value is a measure of the difference between the means of the two groups. A higher t-value indicates a greater difference between the means. In this example, the t-value of 2.57 suggests that there is a significant difference in weight loss between the two groups.
The p-value is the probability of getting a t-value as extreme or more extreme than the one observed, assuming that the null hypothesis is true. A p-value less than 0.05 (the commonly used significance level) suggests that the difference in weight loss between the two groups is statistically significant. In this example, the p-value of 0.014 is less than 0.05, indicating that the difference in weight loss between the two groups is statistically significant.
The degrees of freedom (df) are the number of scores that are free to vary in estimating the population mean and variance. The formula for calculating the degrees of freedom is (n1 + n2 – 2), where n1 and n2 are the sample sizes of the two groups.
Step 6: Presenting your results
Here are a few ways to present the results from a t-test, but one common method is to include the following information in a table or figure:
- The means and standard deviations of the two groups.
- The t-value, p-value, and degrees of freedom.
- Effect size (Cohen’s d).
- Conclusion about whether or not to reject or fail to reject the null hypothesis (H0).
Here’s an example of how the results of a t-test might be presented in a table:
| Group 1 (Drug) | Group 2 (Placebo) | |
|---|---|---|
| Mean weight loss | 3.5 kg | 2.0 kg |
| Standard deviation | 0.8 kg | 0.6 kg |
| t-value | 2.57 | |
| p-value | 0.014 | |
| Degrees of freedom | 18 | |
| Cohen’s d | 0.8 | |
| Conclusion | Reject H0 |
The table shows that the mean weight loss in the drug group was 3.5 kg and the mean weight loss in the placebo group was 2.0 kg. The t-value was 2.57, the p-value was 0.014, and the degrees of freedom were 18. The Cohen’s d was 0.8.
The null hypothesis in this example is that there is no difference in weight loss between the two groups, and the alternative hypothesis is that there is a difference.
The p-value is calculated, which is the probability of getting a t-value as extreme or more extreme than the one observed, assuming that the null hypothesis is true. If the p-value is less than the significance level (usually 0.05), it means that the data is unlikely to have occurred by chance and thus, the null hypothesis is rejected.
In the example I provided, the p-value is 0.014, which is less than the significance level of 0.05, so the null hypothesis is rejected. This means that we accept the alternative hypothesis that there is a difference in weight loss between the two groups.
The conclusion is that the difference in weight loss between the two groups is statistically significant. Based on the p-value of 0.014 and the effect size of 0.8.
In addition, you should also include some text and graphs to explain the results in more detail, such as explaining the meaning of the t-value, p-value, and effect size, and how they were used to make the conclusion. It’s also important to keep in mind to always include the limitations and drawbacks of the test and how your results might be affected by these.
Frequently asked questions
A one-sample t-test is used to compare a sample mean to a known population mean.
A two-sample t-test is used to compare the means of two independent samples.
If the two groups being compared are related, such as pre- and post-treatment measurements on the same individuals, a paired t-test should be used. If the groups are not related, such as measurements from two different groups of individuals, an independent samples t-test should be used.
A t-test is used to compare the means of two groups, while ANOVA (analysis of variance) is used to compare the means of more than two groups.
A t-test assumes that the data is normally distributed and that the variances of the two groups are equal. It also assumes that the data is independent and that the observations are made on a continuous scale.
The p-value is the probability of getting a t-value as extreme or more extreme than the one observed, assuming that the null hypothesis is true. A small p-value indicates that the null hypothesis should be rejected in favor of the alternative hypothesis. The t-value is a measure of how many standard errors the difference between the means is from zero. A large t-value indicates a large difference between the means.
Multiple comparisons corrections methods like Bonferroni correction, Holm-Bonferroni correction, Sidak correction, and False discovery rate (FDR) correction are commonly used for controlling the family-wise error rate when multiple comparisons are made.
You may also like