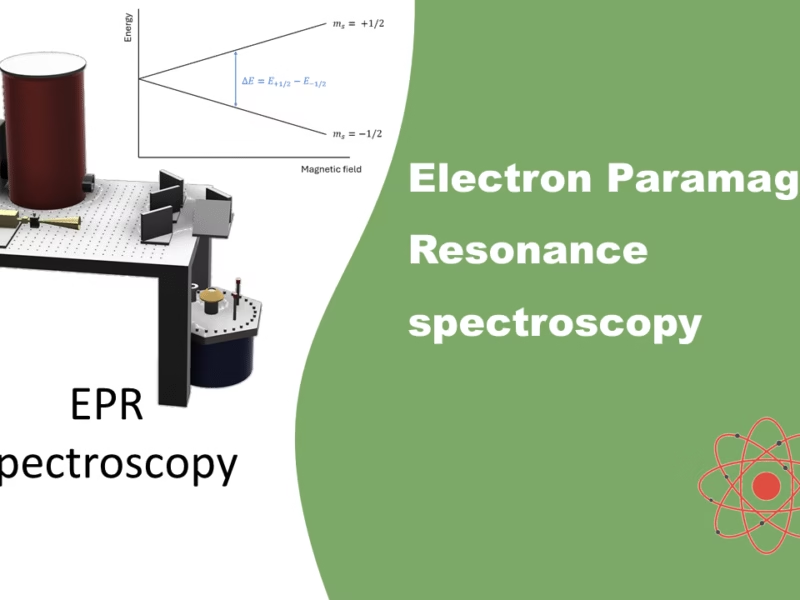
Electron paramagnetic resonance (EPR) spectroscopy, also known as electron spin resonance (ESR), is a powerful technique used to study materials that contain unpaired electrons. This includes a wide range of paramagnetic species such as organic and inorganic radicals, transition metal complexes, and certain magnetic materials. In this post, I’ll break down the principles behind EPR, provide real-world examples of its applications, and explore how an EPR setup is constructed—from the key components to the advanced techniques that enhance its performance.
We’ll cover:
- The Science Behind EPR: How EPR detects the magnetic properties of unpaired electrons.
- Key Components of an EPR System: A deep dive into the microwave source, magnet, resonator, and detection system.
1. EPR spectroscopy
One of the type of devices that uses these type of cryostats with strong superconducting magnets is an Electron Paramagnetic Resonance (EPR) spectroscopy, also known as Electron Spin Resonance (ESR). This setup studies materials that have an unpaired electron. All the concepts are very similar to that of nuclear magnetic resonance, but instead of the excitation of atomic nuclei, the electron spins are being excited.
Every electron has a magnetic moment of ms = 1/2 or -1/2. And in the presence of a magnetic field, the electron will either align itself parallel or antiparallel to the field, each with its own specific energy (E = msgeμBB0). The difference in energy between parallel and antiparallel is proportional to the strength of the magnetic field. The method of detection is by the fact that the electron can flip its spin by the absorption or emission of a photon with that exact energy, such that the resonance condition is obeyed.

For most EPR setups, to obtain the resonance condition, the frequency to excite the sample is being kept constant, and they sweep the magnetic field. However, the opposite is possible where you keep the field stable and sweep the frequency. By increasing the magnetic field, the gap between the two energy states is widening until it equals the energy of the microwave source. The absorption of energy is what you measure.
Because of the difference in mass between electrons and nucleus, the magnetic moment of an electron is much higher. Therefore you will need much higher frequencies for electrons to bring it to resonance than you need for the nucleus. That is why for EPR setups you will work in the GHz – sub THz range and it stays in the MHz range for NMR setups.
A typical EPR setup consists of the following components:
- High-frequency microwave source
- Resonator
- Cryostat
- High-field magnet
- Detection system
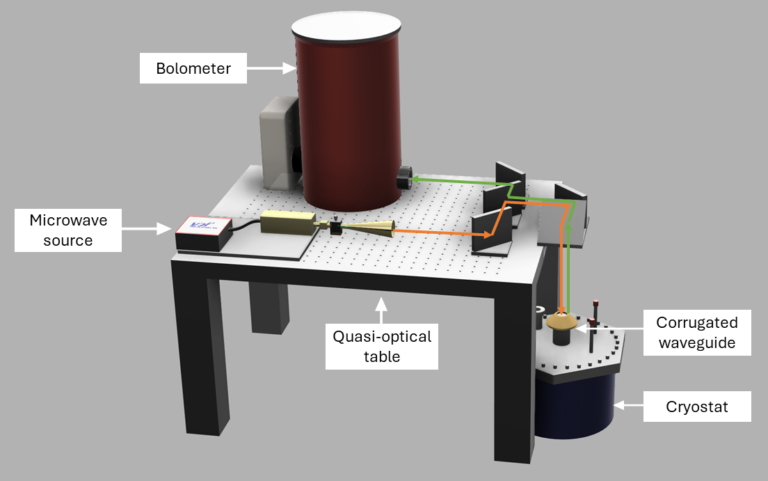
Above I show an illustration of a typical high-frequency high-field EPR setup. It is not the actual setup, as it has more than just these items. You will also note that with these mirrors the signal will never reach the bolometer. It is just meant to give you an idea of what to expect. The orange line shows the electromagnetic wave propagating from the microwave source, over the quasi-optical table towards the cryostat where the sample is located. The green line is the reflected signal propagating to the detector.
Personally, I worked with a high-frequency, high-field EPR setup, that was able to go to 16 T and frequencies up to ~700 GHz. With this, I investigated magnetic materials and their properties. There are upsides of having such a strong and powerful machine, but there are downsides as well, which I will hopefully explain in the sections below where I talk about each indidivual component. I will be explaining a high-frequency EPR setup, but the same will go for EPR setups in the lower 10 GHz – 50GHz, just with slightly different equipment.
1.1 High-Frequency Microwave Source
Due to the magnetic moment of electrons, achieving resonance at high magnetic fields requires high frequencies. This necessitates the use of frequencies in the millimeter-wave range (30 GHz to 300 GHz) and the terahertz range (300 GHz to 3 THz).
Earlier devices often used phase-locked Gunn diodes paired with frequency multipliers as sources. A phase-locked loop module stabilized the Gunn diode frequency, and the multipliers increased the frequency. However, each multiplication step reduces output power due to efficiency losses. Another type of millimeter-wave transmitter employs dielectric resonator oscillators (DROs), which use a dielectric resonator as the frequency-stabilizing element. DROs provide excellent frequency stability, high Q, and very low microphonics, producing steady-state oscillations at their resonant frequency. Typically, DROs operate in the range of a few GHz to tens of GHz with high precision. These frequencies can be multiplied to reach, for example, 94 GHz, the base frequency of some transmitters as supplied by manufacturers. While some tuning around this frequency (+/- a few GHz) is possible, significant deviation leads to a drastic drop in output power. To reach higher frequencies, additional doublers and triplers (either passive or active) can be added, enabling frequencies in the several hundred GHz range.

This approach offers the advantage of conducting measurements at various resonant frequencies, but it also has limitations:
- You are restricted to frequencies that are multiples of the base frequency. To access intermediate frequencies, you need additional sources, which can cost tens of thousands of euros or dollars.
- Each time you use a multiplier, the output power decreases. For instance, starting from hundreds of mW at around 100 GHz, power can drop to just hundreds of μW at 1 THz.
- Your setup must support a broad spectrum of frequencies. Any sub-optimal component will further weaken the signal strength reaching the sample.

Ensuring sufficient power delivery to your sample is crucial. EPR relies on detecting the resonance of unpaired electrons in a sample when exposed to a magnetic field and electromagnetic radiation (microwaves). The strength of the detected signal is directly related to the power of the microwave radiation applied. Higher power increases the probability that electrons will transition between energy levels, thereby producing a stronger EPR signal. A stronger signal improves the sensitivity of the measurement, allowing for the detection of weaker signals or smaller quantities of paramagnetic species.
The quality of the EPR spectrum is largely determined by the signal-to-noise ratio (SNR). Sufficient power helps to enhance the signal without excessively increasing the noise level, resulting in clearer and more accurate spectra. This is especially important when dealing with samples that have low concentrations of paramagnetic species, where the intrinsic signal might be weak.
While sufficient power is important, it’s also crucial to avoid excessive power that can lead to power saturation effects. In EPR, if the applied microwave power is too high, it can cause issues on the detector side.
1.2 Microwave propagation
The electromagnetic wave coming from the microwave source, needs to be directed to the sample. This section explains some of the steps it takes to get there.
1.2.1 Quasioptical bridge
At frequencies above ~90 GHz, losses in single-mode waveguides incease significantly, which can greatly affect the overall noise figure of a setup. That is why Quasi-Optical (QO) techniques are employed. This is done when the components used to manipulate the wave (like lenses, mirrors, and polarizers) are on the order of the wavelength of the radiation being used. This is often the case in millimeter-wave and terahertz systems, where the wavelength is still large enough to require consideration of wave effects like diffraction.
In quasi-optics, electromagnetic waves are treated more like beams that exhibit both ray-like and wave-like properties. The beam shape in quasi-optical systems is typically Gaussian, meaning it has a characteristic bell-shaped intensity profile that must be managed throughout its propagation. As an example, to manage both the ray and wave properties of a beam, concave mirrors focuses on maintaining the integrity of the beam shape (such as a Gaussian profile) and controlling diffraction and other wave-based phenomena.
Another important component is a polarizer. They consts of a wire-grid with a series of parallel, conductive wires spaced much closer than the wavelength of the incident electromagnetic wave. The electric field component of the incoming wave plays a role with it being blocked or passing without attenuation. When the electric field component is parallel to the wires, it induces a current which causes this component to be absorbed. When the elecric field is perpendicular to the wires, it passes through the grid without attenuation.
The electromagnetic beam is being send over the table through these components, to direct it to the sample. However, the sample is located at extreme low templeratures inside a cryostat, and the only way to reach it is through an elongated pipe (the corrugated waveguide, see next section), where the free space propagation condition does not hold.
1.2.2 Oversized Corrugated Waveguide
A corrugated waveguide is an oversized waveguide with a corrugated inner surface instead of a smooth one (see Fig. 2.2). The groove depth of the corrugation is given by d = λ/4, with a typical period p < λ/4, (i.e. λ = 1 mm corresponds to 300 GHz). When the wavelength λ satisfies λ = 4d, the microwave propagation experiences minimal losses, known as the balanced condition. In this state, the reactance of the waveguide walls tends to infinity, leading to negligible microwave losses.

The issue is that you will rarely mention just a single frequency. However, outside the balanced condition, lower microwave losses are still achieved compared to a smooth waveguide, provided the corrugation depth d lies within the range 0.35 λ/4 ≤ d ≤ 1.75 λ/4. Additionally, the microwave losses in oversized corrugated waveguides are proportional to λ2/r3, where r is the radius of the waveguide. This implies that higher frequencies result in even lower losses.
In a circular corrugated waveguide, the hybrid HE11 mode is propagated, which is approximately a combination of the TM11 and TE11 modes propagating at the same rate. Circular corrugated waveguides offer excellent polarization properties if the diameter 2r is large enough and d ≈ λ/4, allowing the HE11 mode to propagate with high purity. Both orthogonal polarizations (cross-polar and co-polar) propagate under the same conditions, which is crucial for induction mode applications. These properties make circular corrugated waveguides ideal for use in cryostats. Nowadays, corrugated waveguides are widely used in modern HF-EPR systems.
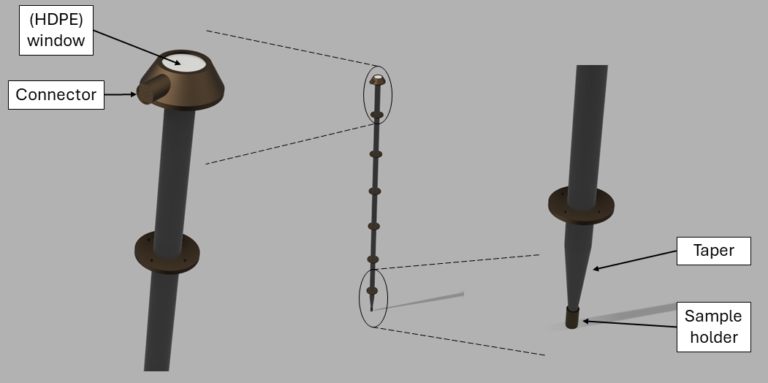
Figure below shows an illustration of a corrugated waveguide, the taper and the sample location. A typical corrugated waveguide has an inner diameter of around 18 mm, and a total probe length of around 1.3 m. The waveguide itself should be sealed from the inside, hence it has a cap with a high-density polyethylene (HDPE) window, with a refractive index n = 1.525 at 300 GHz and a thickness of 1 mm at the top of the probe. This type of material is transparant for the range of frequencies of the setup. The microwave losses in the corrugated waveguide are well below 1 dB/m for typical microwave sources.
1.2.3 Resonator & Sample Holder
At the base of the corrugated waveguide is the sample holder, which comes in different types, including a Fabry-Pérot resonator and a non-resonant holder. While I don’t have personal experience with the Fabry-Pérot resonator, I recommend referring to the book Optical Resonators by N. Hodgson and H. Weber for more details.

The non-resonant cavity, also known as a “double-pass” cavity, is a smooth, hollow cylinder with a diameter of approximately 6 mm and a brass mirror at the bottom. The ensemble is located at the bottom of the corrugated waveguide at the tip of the taper that focusses all the energy into this small cylinder. The upper surface of the brass piece is gold-plated to reflect incoming electromagnetic waves back toward the detector. The sample is placed on the mirror, and as it absorbs part of the incident wave’s energy, less energy is reflected. This setup is referred to as a non-resonant cavity because the wave passes through the sample only twice—once on entry and once on reflection. For this reason, it’s also called a “double-pass” cavity and has a very low quality factor (Q) compared to true resonant cavities.
The ensemble is placed in the bore of a modulation coil, which has an alternating magnetic field (HAC), and is much smaller then the field of the superconducting magnet. This field helps detecting the signal, and is better explained in section 1.4.1.
During my magnetic resonance research, we developed a compact sample holder (less than 6 mm in diameter to fit inside the cylinder) that positions the sample transverse to the incident beam. The sample holder was made from the same transparant material as I discussed before, so it did not interfere in the measurement. I was able to connect both ends of the holder to measure the voltage generated by spin pumping, while at the same time measuring the EPR absorption signal.
1.3 Helium-4 Cryostat & Superconducting magnet
the EPR measurements are performed at low temperatures, down to 1.5 K, and strong magnetic fields up to 16 T in a cryostat system, such as those made by Oxford Instruments. Such a cryostat setup consists of a low-loss Helium-4 (He-4) dewar, a superconducting magnet and a variable temperature insert.
The figure below shows the main framework of the He-4 refrigerator, which is inside the low-loss dewar. The liquid helium bath is designed in a way that it is very well insulated from any thermal conduction from the outside environment. The two vacuum layers (Vacuum isolation & Outer vacuum jacket) are pumped to pressures lower then 10-6 mbar to surpress the thermal conduction and convection. The liquid nitrogen jacket is placer around the outside of the He-4 bath to serve as a precooler and absorb infrared radiation from the room temperature environment. All these insulating layers ensure that there is very low loss of liquid Helium.
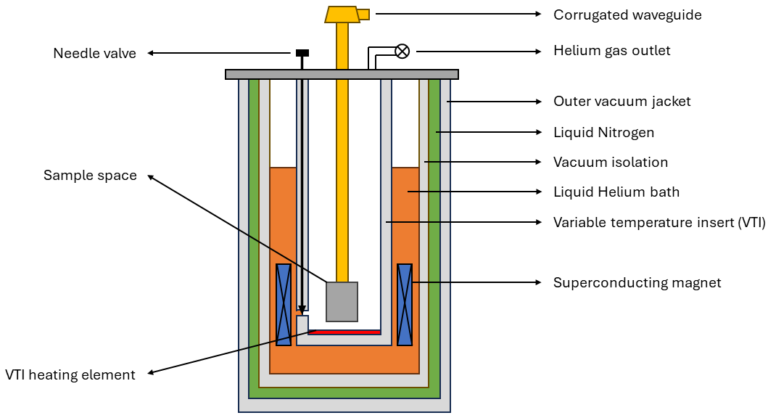
The superconducting magnet is placed in the liquid Helium bath. It is powered by an Oxford IPS-120 current source, with which the magnet can generate a uniform magnetic field up to 16 T, either downward or upward. More on this in the next section.
The variable temperature insert is placed inside the bore of the magnetic coil, with the Helium bath on the outside and pumped to a high vacuum on the inside. This part is used to variably change the temperature on the sample from 1.5 K up to 300 K. It operates as follows. Liquid helium can flow through a small capillary into the inner space, where the rate of flow is controlled by a needle valve. This liquid Helium will evaporate, and the cold gas will flow through the space to the top where it is being pumped out. A wide range of temperatures can be stabilized by the combination of an auxiliary heater at the bottom of the VTI and the gas being pumped out at the top.
Traditional cryostats use liquid helium-4 as the cooling agent, which can cool systems down to about 4.2 K at atmospheric pressure. To achieve temperatures lower than this, additional techniques such as pumping on the liquid helium can bring the temperature down to around 1.5 K. Helium-3 can be used to achieve temperatures down to around 0.3 K. He-3 has a lower boiling point than He-4 and, when pumped, can reach these lower temperatures.
In addition, a dilution refrigerator can be used in combination with the above described cryostat to reach temperatures as low as 2 mK. It uses a mixture of Helium-3 and helium-4 isotopes to do this. I personally never used it, but there are many laboratories who do use this.
1.3.1 Superconducting magnets
Niobium-tin (Nb3Sn) is a common superconducting material used in high-field magnets, and it has a higher critical temperature compared to many other superconductors like niobium-titanium (NbTi). The critical temperature for Nb₃Sn is about 18 K, which is significantly higher than materials requiring cooling by liquid helium near its boiling point of 4.2 K.
It is known for its ability to generate very strong magnetic fields, making it an essential material in many high-performance superconducting applications. Nb₃Sn can achieve magnetic fields in the range of 10 to 24 Tesla. However, in most physics applications due to practical limitations, it can reach magnetic fields of up to 16 Tesla.
A lot of precautions are required when working with large magnetic fields. When a superconducting magnet exceeds certain limits, quenching can occur. Every superconductor has a critical magnetic field above which it can no longer maintain superconductivity. If the applied magnetic field becomes too strong, the material transitions to a resistive state. The electrical current, which was flowing without resistance, now encourters resistance in the coils. As a result, the current generates heat, that can vaporize the cryogens (i.e. the liquid Helium), used to cool the magnet, causing a potential explosive release of gas. This process is called boil-off. If the excess Helium escapes from the cryostat (through a rupture), it can displace the oxygen in confined spaces, and result in asphyxiation. Another danger is that the introduction of resistance in combination with large amps, can cause a significant voltage spike of thousands of volts, posing a serious hazard if not controlled.
This is why it is important to slowly ramp up the field to the desired strength. This can easily take half an hour or longer (imagine going from +16 Tesla to -16 Tesla), limiting the amount of research you can do within the timeslot.
1.4 Detection System - The Bolometer
An Indium Antimonide (InSb) hot electron bolometer has an excellent detection sensivity over a large frequency range. The working principle is based on the thermal response of “hot electrons” in the InSb material to incoming radiation. To reduce the noise, it operates at cryogenic temperatures (similar to the refridgerator discussed before), close to 4 K. When radiation (in the THz range), strikes the InSb material, it transfers energy to the free electrons in the conduction band. These electrons absorb this energy and become “hot” electrons, meaning their temperature rises without a significant rise in the temperature of the crystal. The temperature rise of these hot electrons leads to a change in the electrical resistance of the InSb material, which can be measured (through a Wheatstone bridge for example).
After a first internal amplification stage, the signal from the detector is fed into a Lock-in amplifier (such as the Stanford SR830).

1.4.1 Lock-in Amplifier
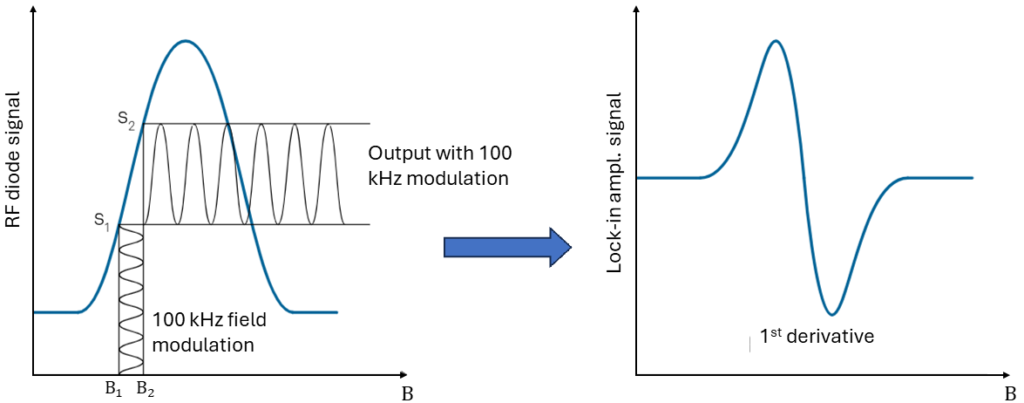
To enhance the signal-to-noise ratio, a lock-in amplifier is often employed. This device uses a modulating magnetic field (HAC) at a known frequency. To generate this modulated magnetic field, a set of Helmholtz coils powered by an AC source is utilized and placed around the sample. The amplitude of the AC magnetic field is very small (~ 1 Oe) and is superimposed on the larger HDC field, generated by the superconducting magnet.
The Figure below illustrates the concept of obtaining the signal with a the lock-in amplifier. During the sweep of the large HDC field, a small AC magnetic field with a fixed frequency of 100 kHz modulates the signal. Under resonance conditions, this small modulating field produces a significant signal during the rising and falling portions of the resonance absorption signal. When the obtained signal is flat (at its peak and outside of resonance under ideal conditions), the lock-in amplifier signal is also zero. Note that this method effectively generates a derivative of the absorption signal.
2. References
Additional reading on the following topics:
Florius
Hi, welcome to my website. I am writing about my previous studies, work & research related topics and other interests. I hope you enjoy reading it and that you learned something new.
More Posts

